# ERCOT Offer and Bid Curve Data
Throughout our Snowflake Marketplace Listing, offer and bid curve data is stored as arrays of (quantity, price) pairs. You will primarily see this in the ERCOT DAM and SCED 60 day disclourse dataset tables.
In this guide, we will walk you through how to query this data with some examples
### The raw offer curve data
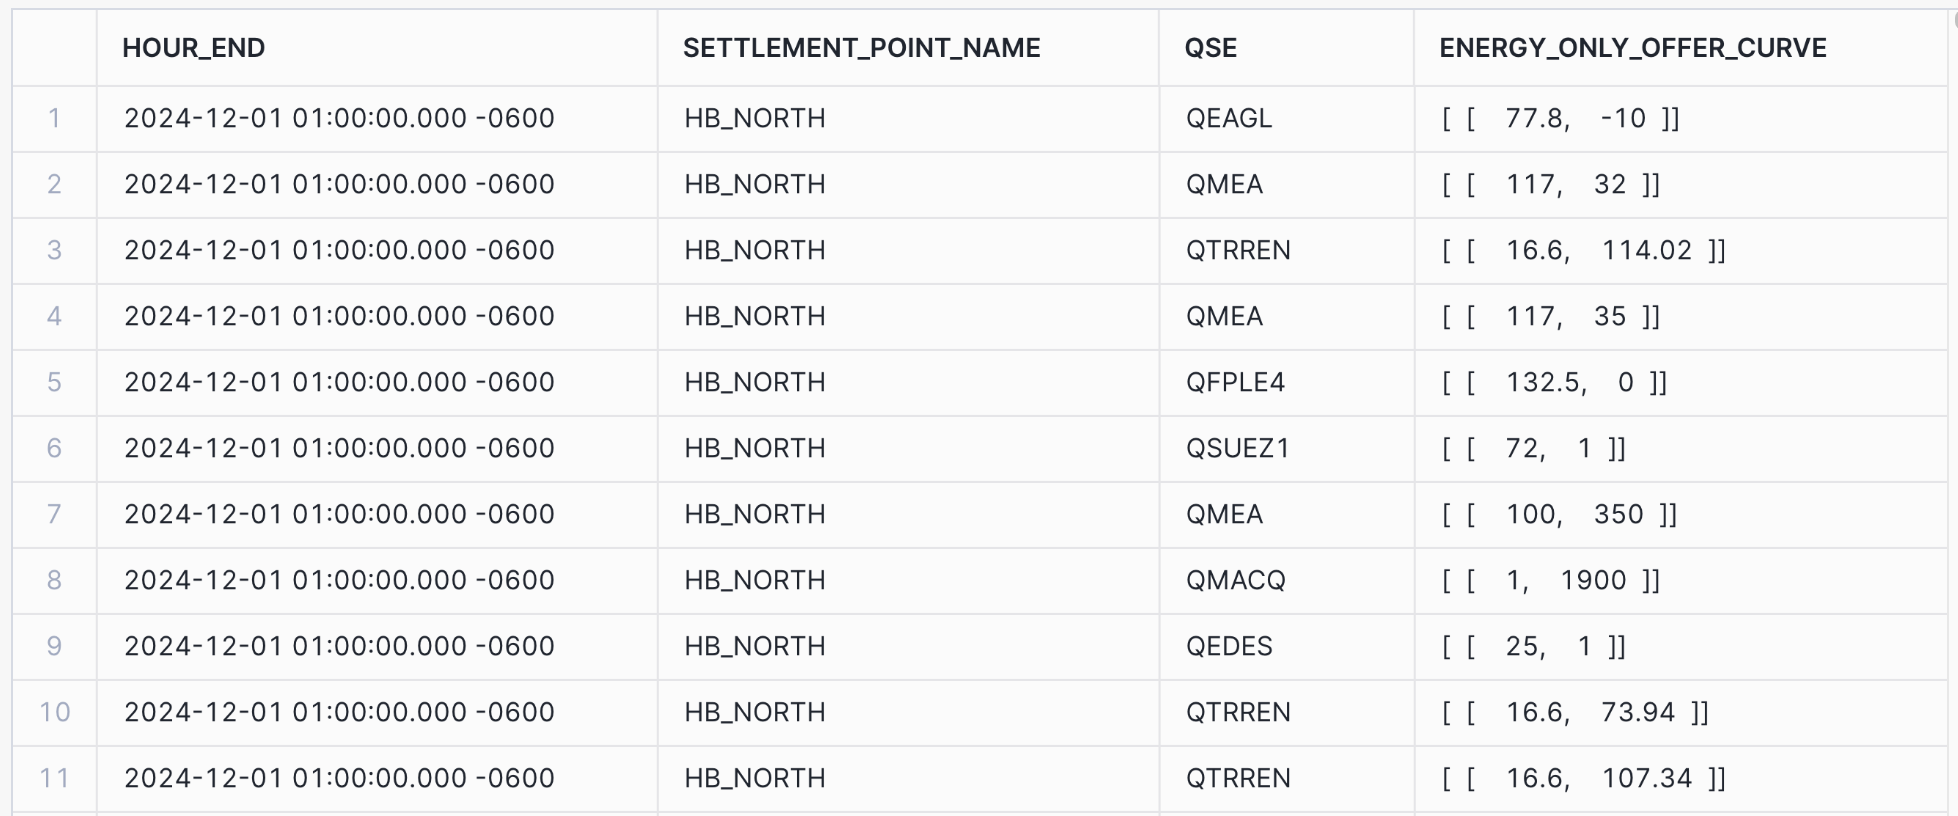
This is what the raw data looks like. Compared to the ERCOT source data, the data on Grid Status is a single column that represents all offer curve points the QSE submitted
We organize the data this way because there could be a variable number of points on the bid/offer curve. By organizing the data as a array, we find it is easier to manipulate into the desired form for deeper analysis.
```sql
SELECT
interval_end_local as hour_end,
settlement_point_name,
qse,
energy_only_offer_curve
FROM
ercot_dam_energy_only_offers_60_day
WHERE
settlement_point_name = 'HB_NORTH'
AND
interval_start_local::DATE = '2024-12-01'
ORDER BY
hour_end ASC;
```
### Reorganizing to columns to look like ERCOT source data
If you prefer to look at the curve as columns, you can do a query like this. Because there could be up to 10 points on the curve, you will see null values for offers that have less
```sql
SELECT
interval_end_local AS hour_end,
settlement_point_name,
qse,
-- Access the elements within the JSON array with MW first and then price
energy_only_offer_curve[0][0]::FLOAT AS mw_1,
energy_only_offer_curve[0][1]::FLOAT AS price_1,
energy_only_offer_curve[1][0]::FLOAT AS mw_2,
energy_only_offer_curve[1][1]::FLOAT AS price_2,
energy_only_offer_curve[2][0]::FLOAT AS mw_3,
energy_only_offer_curve[2][1]::FLOAT AS price_3,
energy_only_offer_curve[3][0]::FLOAT AS mw_4,
energy_only_offer_curve[3][1]::FLOAT AS price_4,
energy_only_offer_curve[4][0]::FLOAT AS mw_5,
energy_only_offer_curve[4][1]::FLOAT AS price_5,
energy_only_offer_curve[5][0]::FLOAT AS mw_6,
energy_only_offer_curve[5][1]::FLOAT AS price_6,
energy_only_offer_curve[6][0]::FLOAT AS mw_7,
energy_only_offer_curve[6][1]::FLOAT AS price_7,
energy_only_offer_curve[7][0]::FLOAT AS mw_8,
energy_only_offer_curve[7][1]::FLOAT AS price_8,
energy_only_offer_curve[8][0]::FLOAT AS mw_9,
energy_only_offer_curve[8][1]::FLOAT AS price_9,
energy_only_offer_curve[9][0]::FLOAT AS mw_10,
energy_only_offer_curve[9][1]::FLOAT AS price_10
FROM
ercot_dam_energy_only_offers_60_day
WHERE
settlement_point_name = 'HB_NORTH'
AND
interval_start_local::DATE = '2024-12-01'
ORDER BY
hour_end ASC;
```
### Reformatting each point on offer curve as a row
A common way to reshape the data is to put each offer curve point on a row
```sql
SELECT
interval_end_local AS hour_end,
settlement_point_name,
qse,
f.value[0]::FLOAT AS mw,
f.value[1]::FLOAT AS price
FROM
ERCOT_DAM_ENERGY_ONLY_OFFERS_60_DAY,
LATERAL FLATTEN(input => energy_only_offer_curve) AS f
WHERE
settlement_point_name = 'HB_NORTH'
AND
hour_end = '2024-12-01 01:00:00.000 -0600'
ORDER BY
hour_end, settlement_point_name, price, qse;
```
### Build an offer curve of a specific interval
We can take the query above one step further by making an offer curve showing the total and cumulative amount offered at each price. As the cumulative amount increase, so does the price.
```sql
WITH TotalOfferByPrice AS (
SELECT
interval_end_local AS hour_end,
settlement_point_name,
f.value[1]::FLOAT AS price,
SUM(f.value[0]::FLOAT) AS total_mw
FROM
ercot_dam_energy_only_offers_60_day,
LATERAL FLATTEN(input => energy_only_offer_curve) AS f
WHERE
settlement_point_name = 'HB_NORTH'
AND interval_end_local = '2024-12-01 01:00:00.000 -0600'
GROUP BY
interval_end_local,
settlement_point_name,
f.value[1]::FLOAT
)
SELECT
hour_end,
settlement_point_name,
price,
total_mw,
SUM(total_mw) OVER (PARTITION BY settlement_point_name, hour_end ORDER BY price ASC ROWS BETWEEN UNBOUNDED PRECEDING AND CURRENT ROW) AS cumulative_mw
FROM
TotalOfferByPrice
ORDER BY
cumulative_mw;
```
This is just the tip of the iceberg when it comes to analysis of the offer and bid curve data. Let us know if there are any other examples you'd like to see!
.png?alt=media)
.png?alt=media)
.png?alt=media)